HVaR is now a basic risk management tool widely used by risk managers of all stripes. In its most commonly used form in which all days are equally weighted, it asks the following question: what would happen to my current portfolio if the market movements from a particular date from the past were to occur again today? It then cycles through every date over a particular historical range – typically either three years or twelve years – and records the experiment for each date, arriving at a P&L distribution for the portfolio from which HVaR is extracted.
So the basic underlying premise behind HVaR is that the present dynamics are captured in past behavior.
But what to do when the world changes?
Things are always in flux, but usually somewhat gradually, and sharp moves in the market only last for a brief period. At least this has been true for most markets, but current events suggest that some commodities – especially the energy products – are now entering an entirely new trading pattern that past history will not capture: it’s a new world.
Of course we are referring to the Russian invasion of Ukraine, and the West’s response.
The commodity that is the most impacted is probably Natural Gas. Almost 40% of the EU’s natural gas annually comes from Russia, according to Eurostat, and the EU members have vowed to free themselves of this dependency as soon as possible. It won’t be easy for a variety of reasons, and estimates of the time it will require to effect this transition range from one to three or more years.
But what do the markets have to say about it?
The graph below plots the Spot, 1 Year and 2 Year weekly futures prices for the past ten years, followed by a close up of daily prices for the past year. By looking at 1 Year and 2 Year expiries we have minimized any seasonality effect in the spreads.
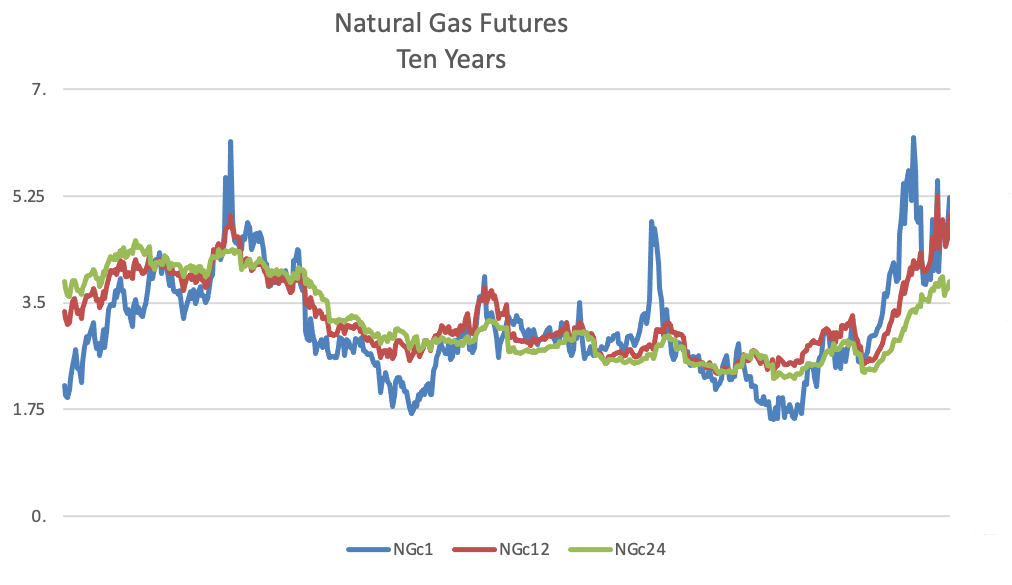
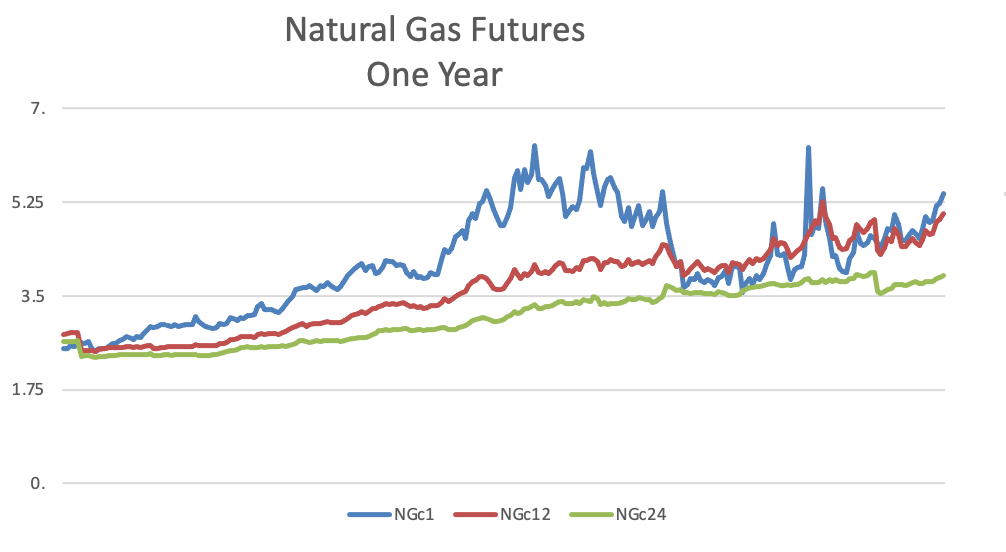
We can see that historically, the 1 Year and 2 Year have tracked together more closely than with Spot. Until recently, that is. Now the 1 Year is tracking Spot, and for good reason: the market is reflecting the minimum consensus time frame for Europe to exit Russian natural gas. We expect this new relationship to hold for the meantime, and gradually weaken as steps are taken to reduce this dependency.
So what does this mean for risk management?
Modifying the HVaR calculation
This new tighter relationship between the 1 Year forward and Spot is not reflected in the historical data used in HVaR. However, at TSImagine we have recently developed tools that can be used to modify selected portions of the historical simulations to reflect the current linkage, without disturbing the other risk factors. For example, we can set the 1 Year forward to use a single factor model in which the underlying factor is Spot, along with a random residual error term. If the residual error is set to zero, then the forward will be perfectly correlated with the Spot. This means that when executing HVaR, the actual returns on the forward will now be ignored in favor of the synthetic returns from the factor model.
Furthermore we can specify when the override is to be applied, in this case only those dates prior to the Russian invasion. Over time, as new history comes in, the overrides will eventually roll out.
Example: 1 Year / 2 Year calendar spread.
This simple example was chosen to highlight the potential impact of this change. We consider 3Y 99% HVaR under three scenarios:
- Scenario 1: Vanilla HVaR
- Scenario 2: Modified HVaR as described above, with a beta of 1.0 and a residual error of zero.
- Scenario 3: Modified HVaR in which the 1 Year has a beta of 0.8 on Spot, and a beta of 0.2 on the 2 Year
Note: Scenario 3 allows for some “pull” from the longer dated forward, so that the 1 Year is no longer perfectly correlated with spot.
Our portfolio was long 1,000 contracts of the 2 Year, and short 1,000 contracts of the 1 Year, with an initial margin of $4.73m. Our VaR numbers are then expressed as a percentage of the initial margin.
| Scenario 1 | Scenario 2 | Scenario 3 |
| 22.2% | 69.7% | 56.5% |
In this example, we can see, unsurprisingly, that there is a material difference in HVaR across the three scenarios.
Conclusion
HVaR as commonly used is very rigid. This is a strength in that there is no ambiguity as to how it is calculated; there are no hidden assumptions, only that the future should look like the past. But this rigidity is also a weakness in that it cannot respond to a bona fide structural change in the markets such as is occurring today with the energy contracts. The effect of the Russian invasion of Ukraine and the subsequent sanctions from the West is simply not present in the tea leaves of past returns.
However, there are ways of “updating history” to incorporate these new relationships through factor models without disturbing the unaffected portions of your portfolio. The effect of the factor models will diminish over time as new observations come in.
The features mentioned in this article are natively available within the TS Imagine risk platform. Our clients are invited to contact their customer support team for further information.